── Conflicts ────────────────────────────────────────── tidyverse_conflicts() ──
✖ dplyr::filter() masks stats::filter()
✖ dplyr::lag()    masks stats::lag()
✖ dplyr::select() masks MASS::select()
ℹ Use the conflicted package (<http://conflicted.r-lib.org/>) to force all conflicts to become errors
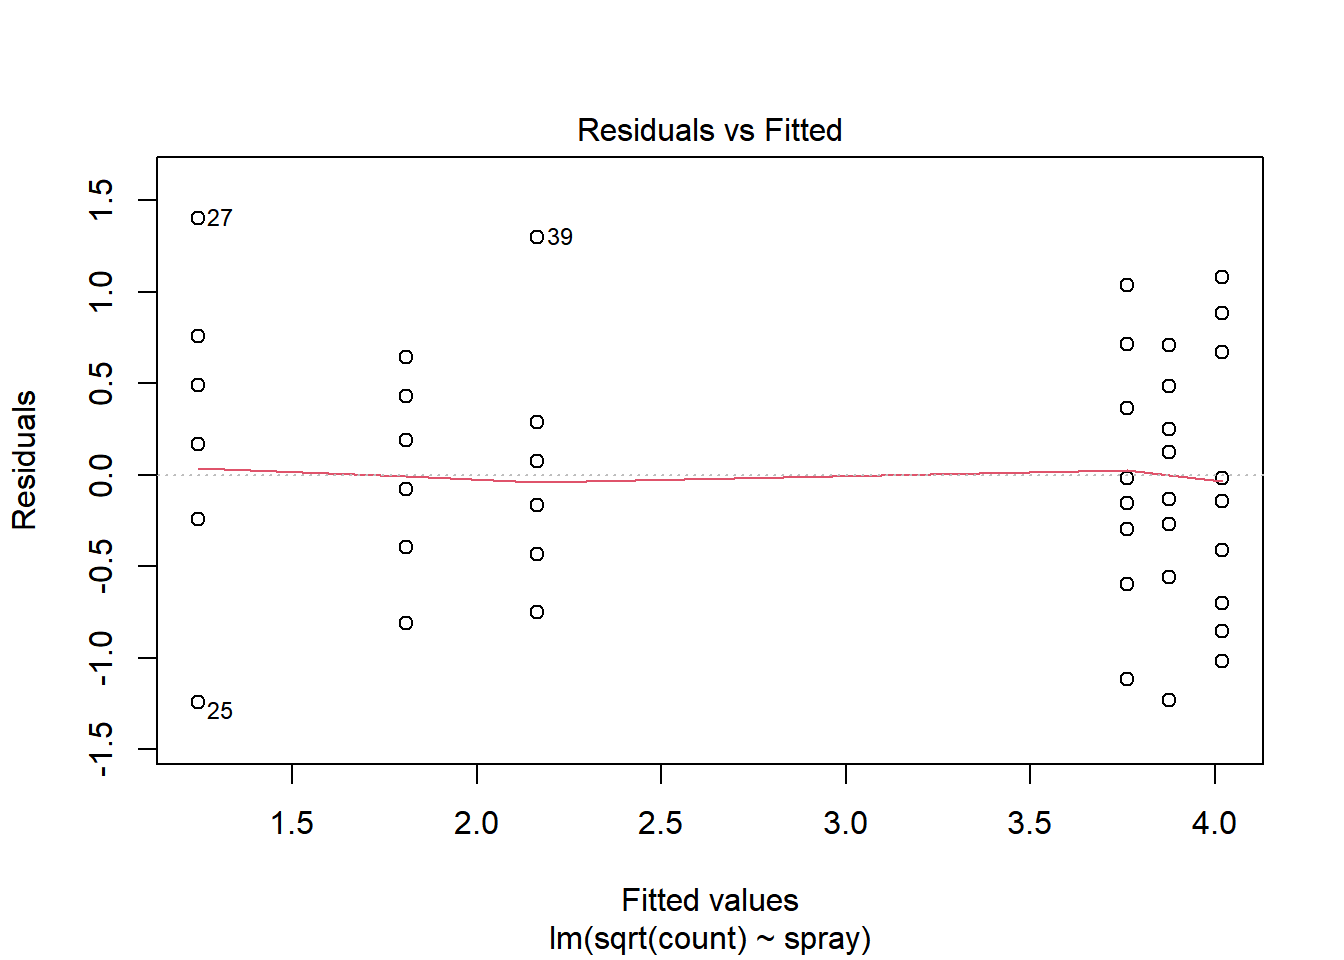
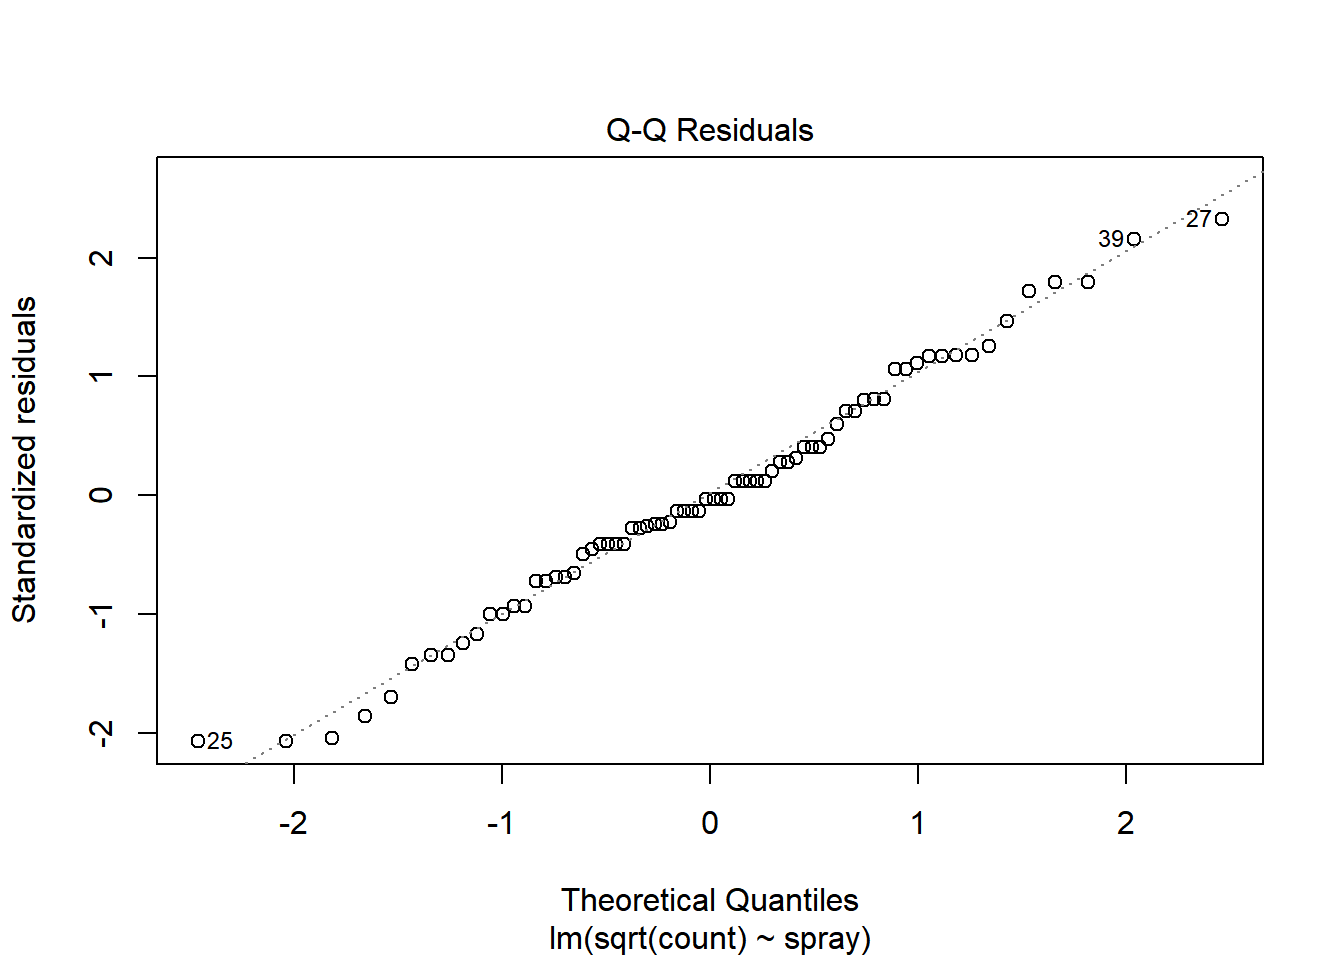
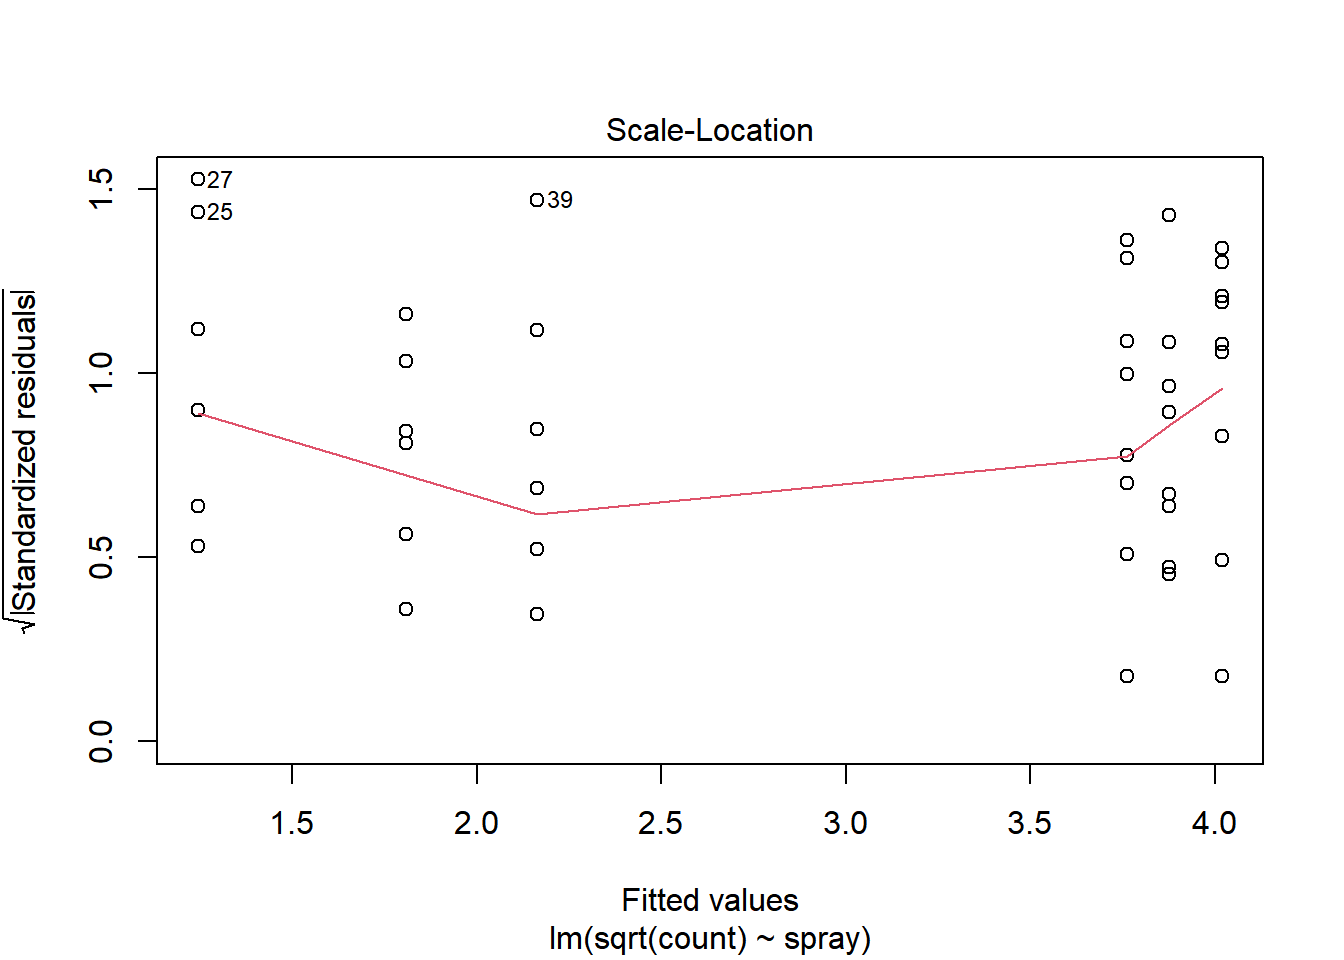
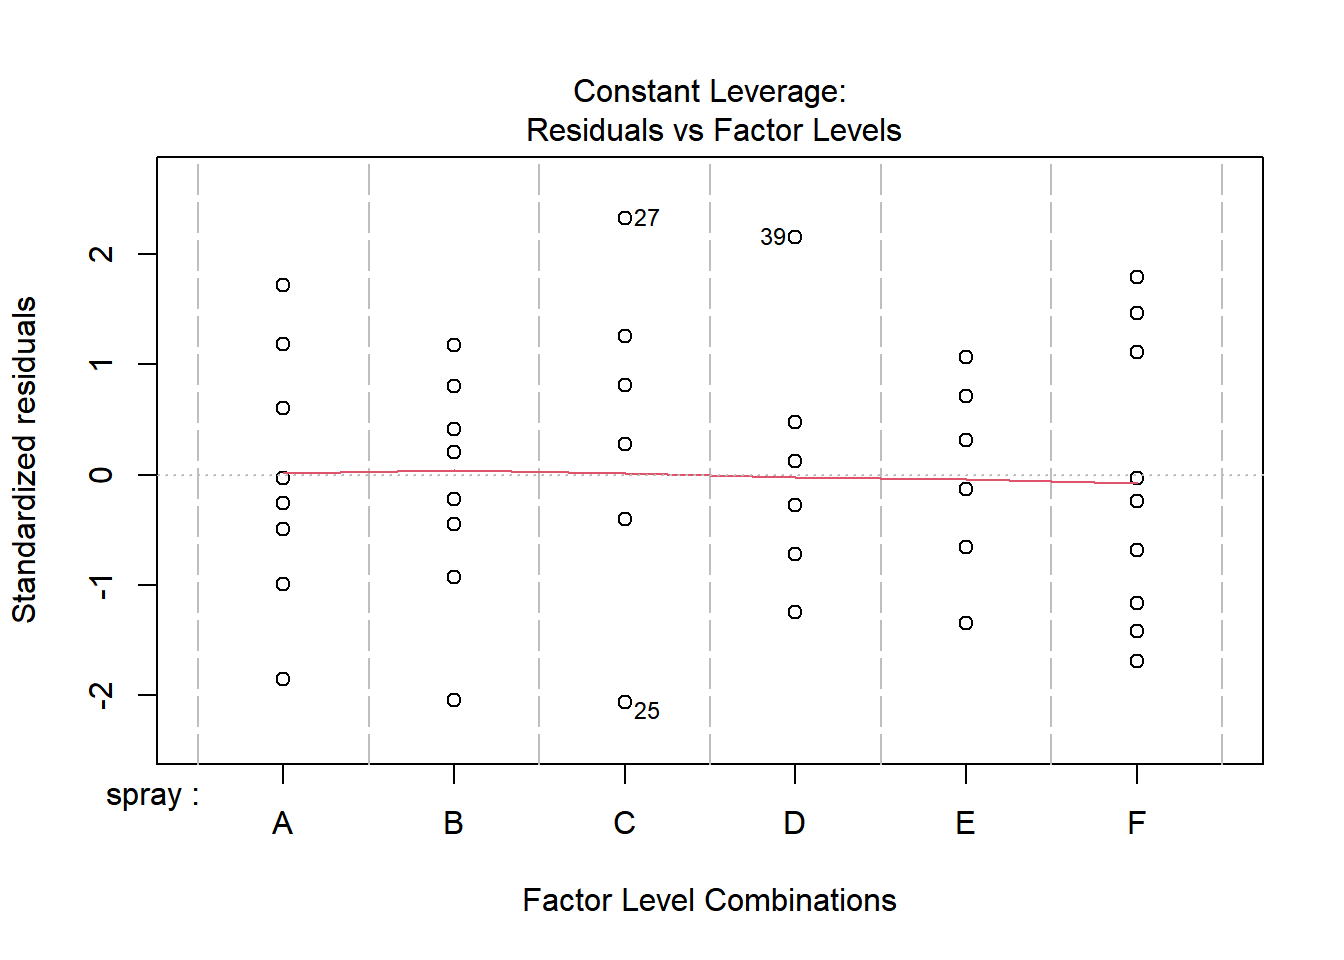
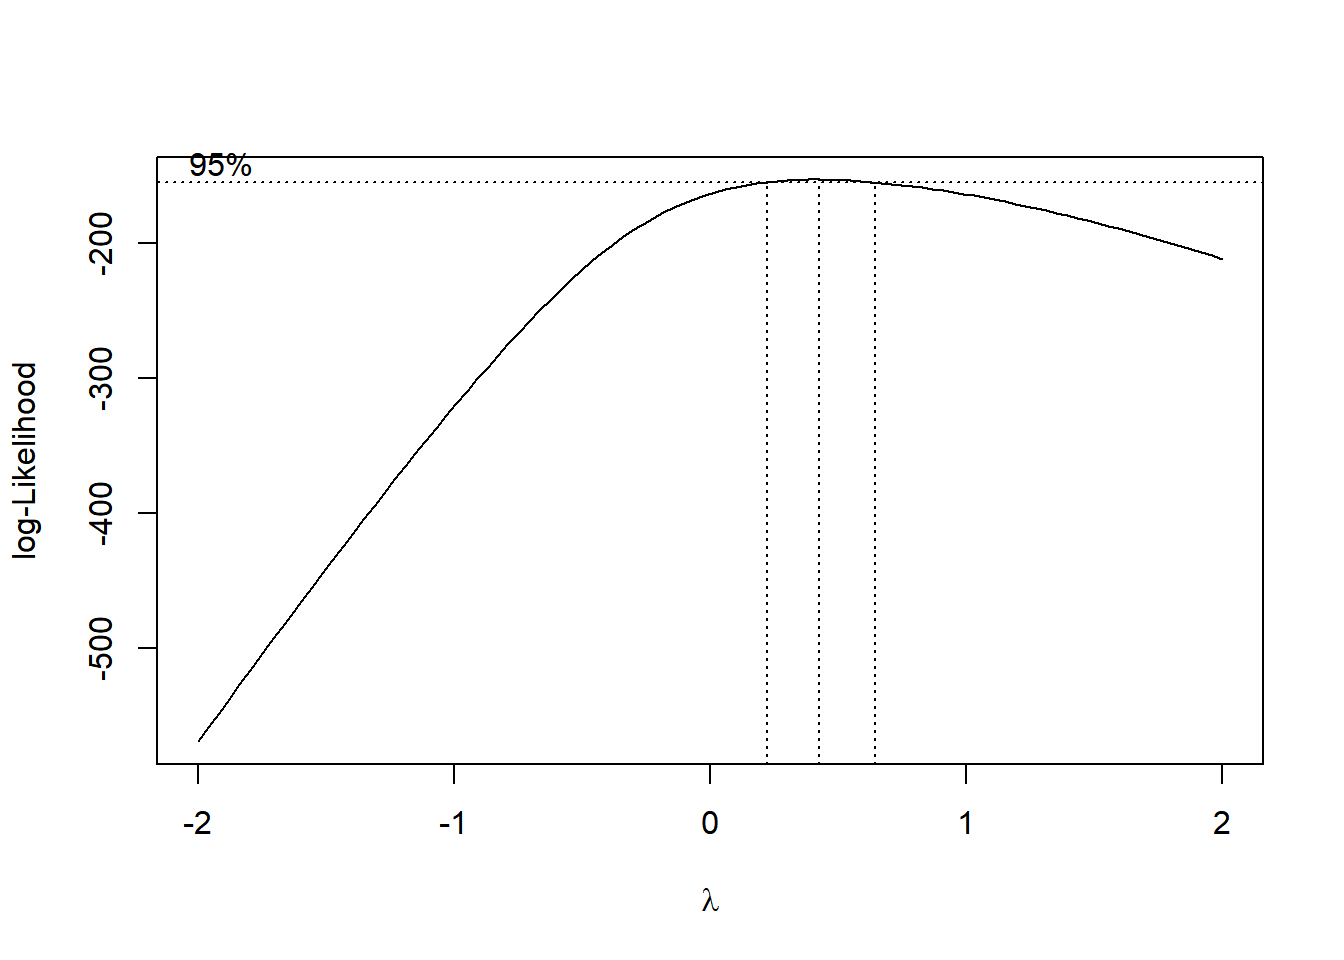
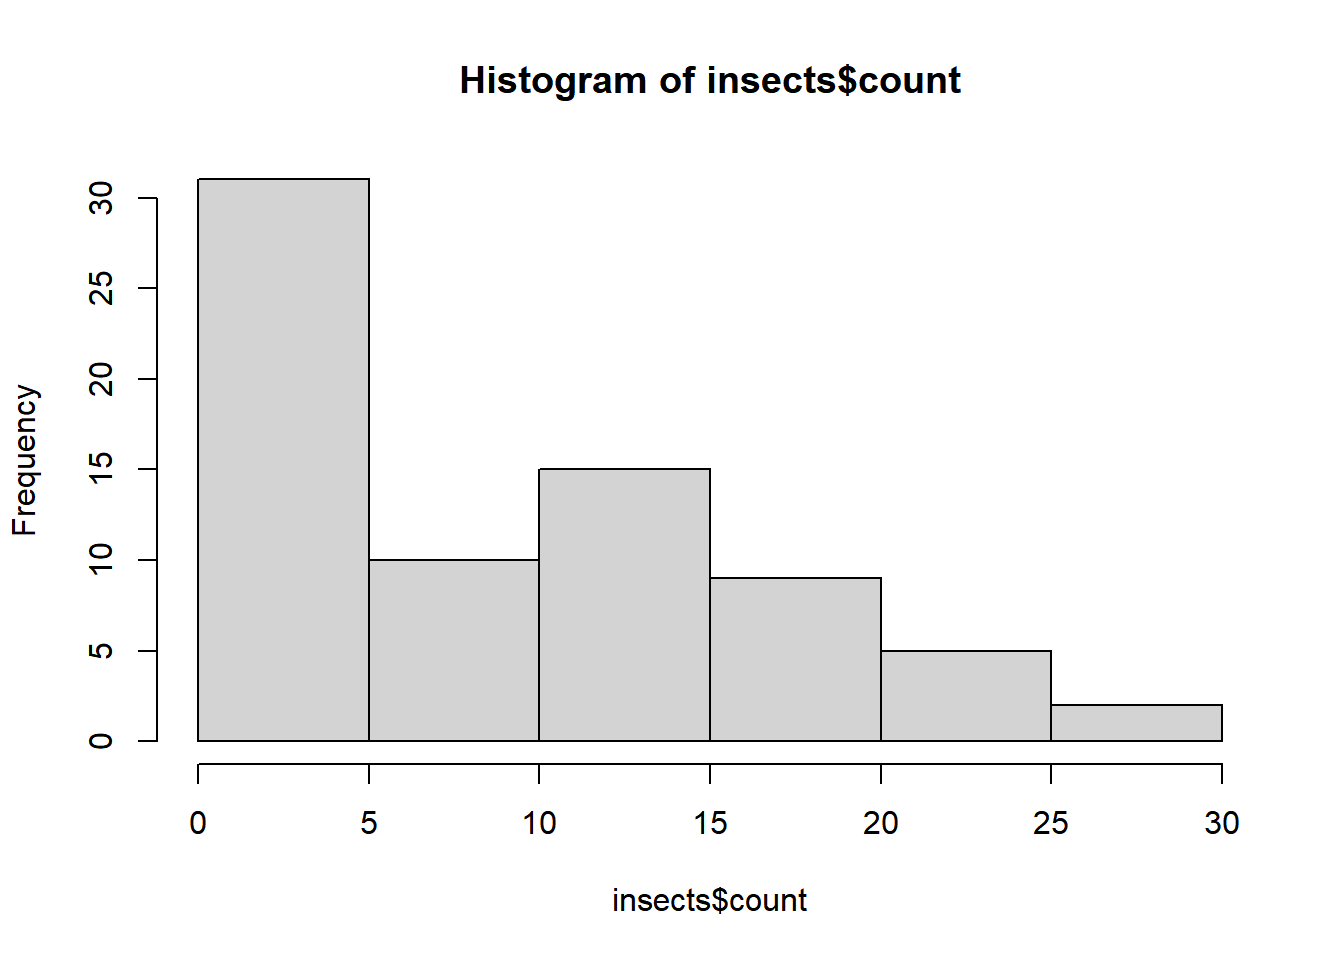
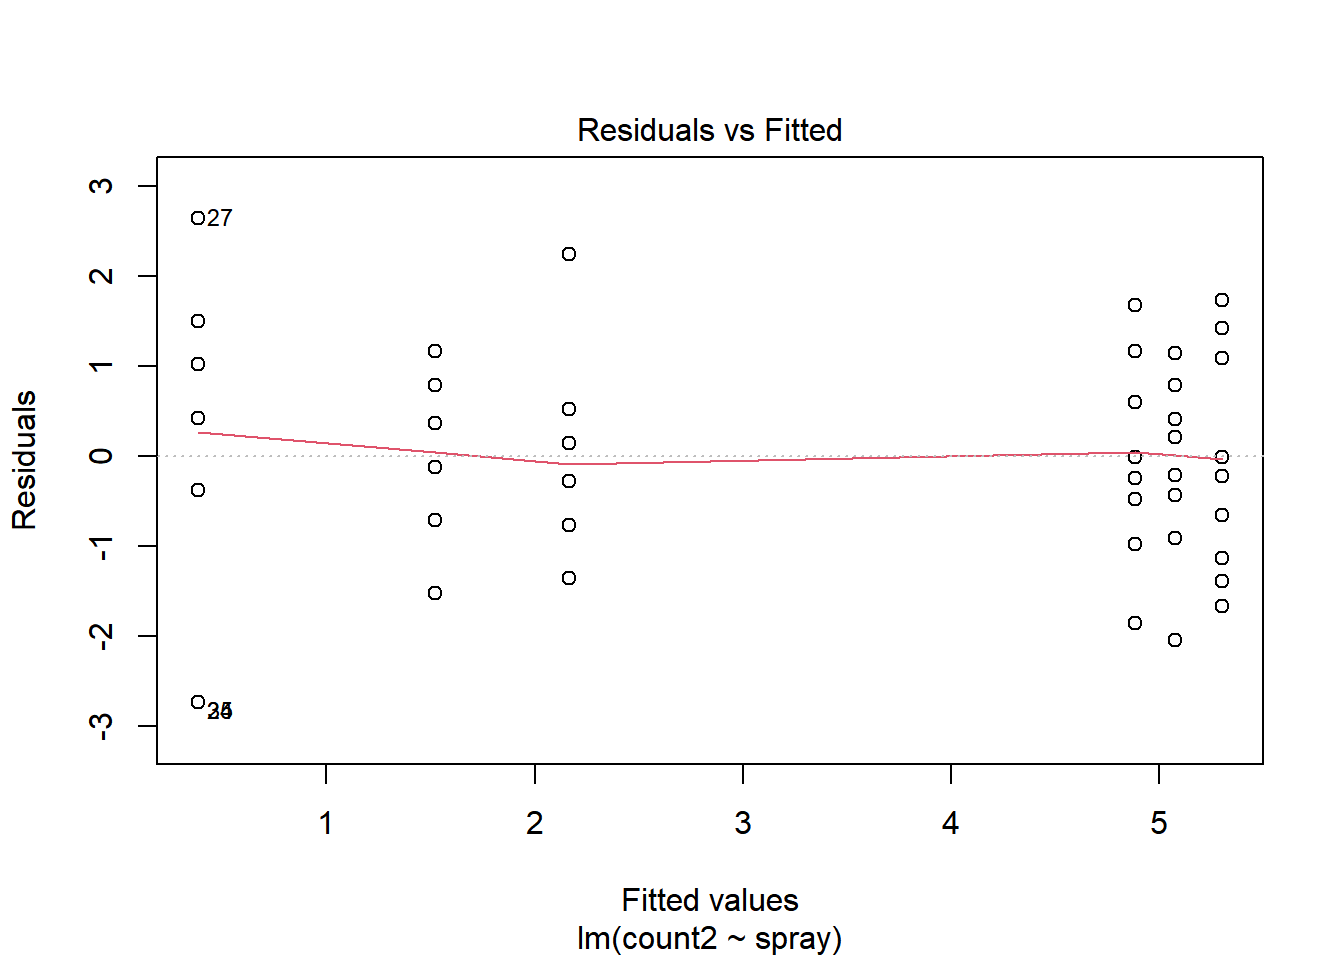
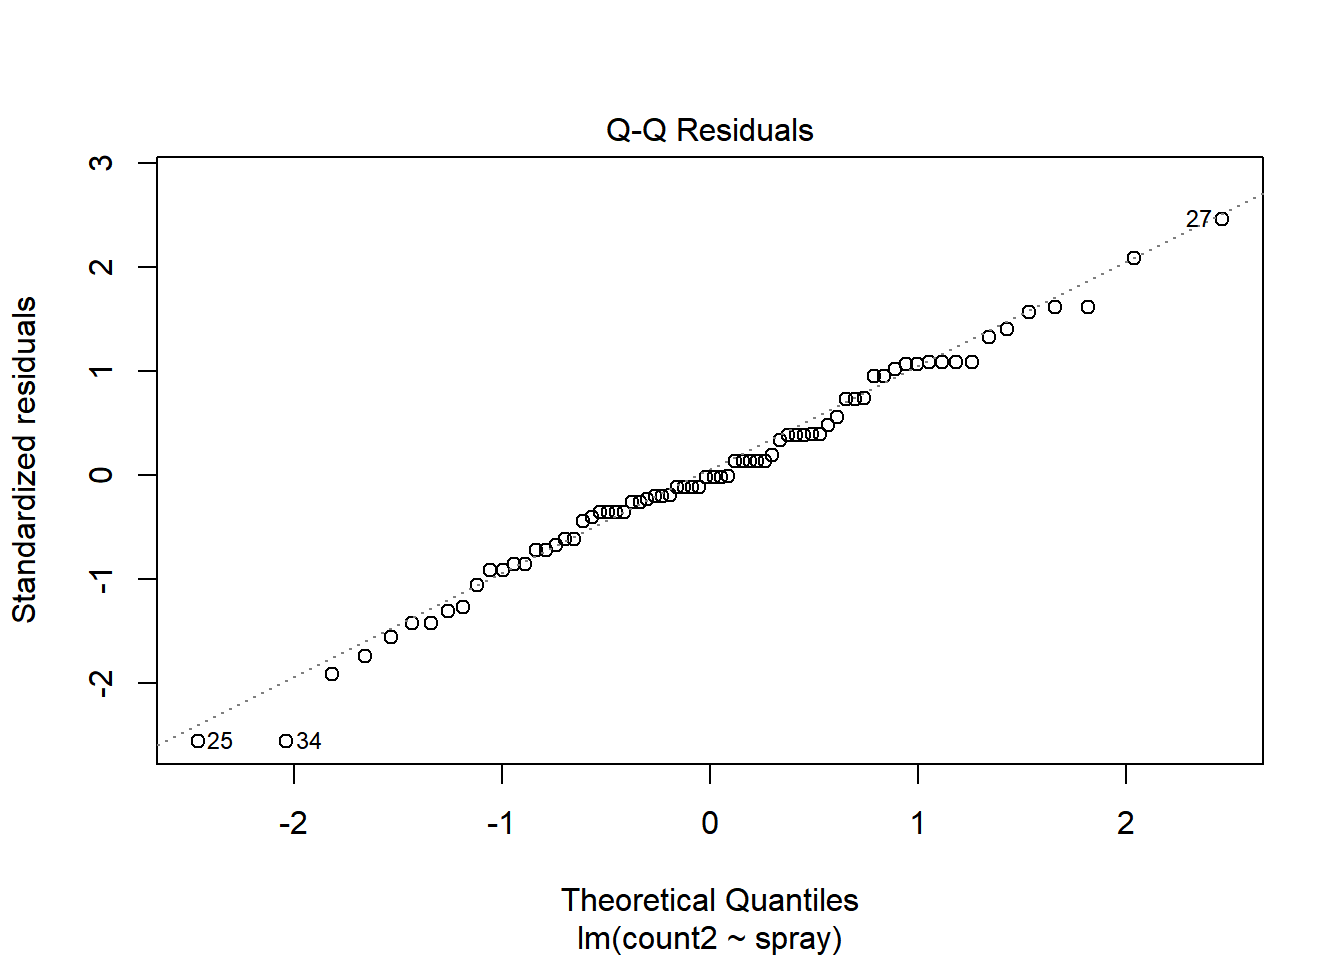
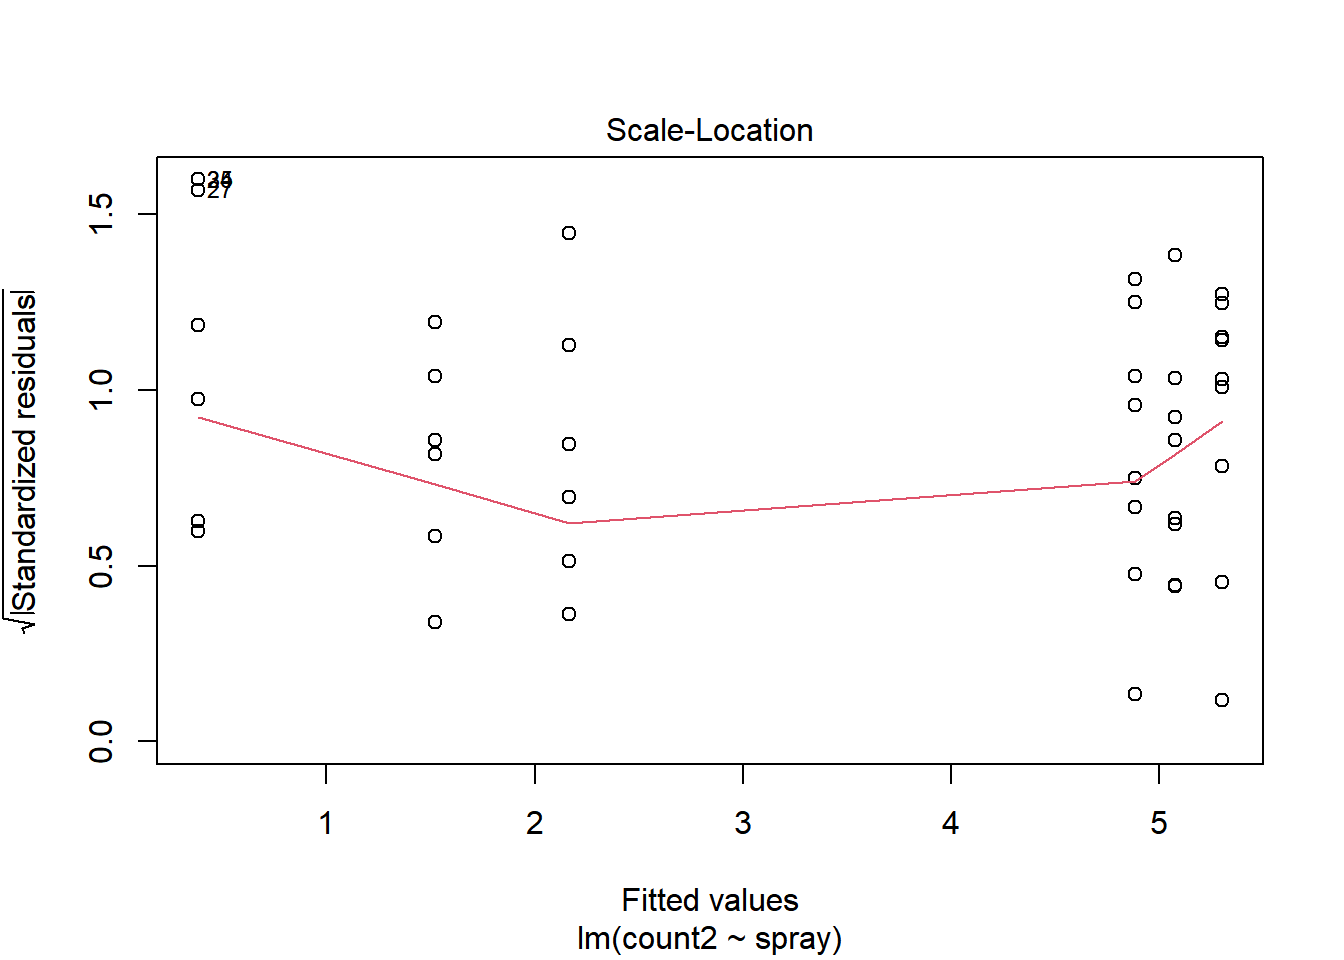
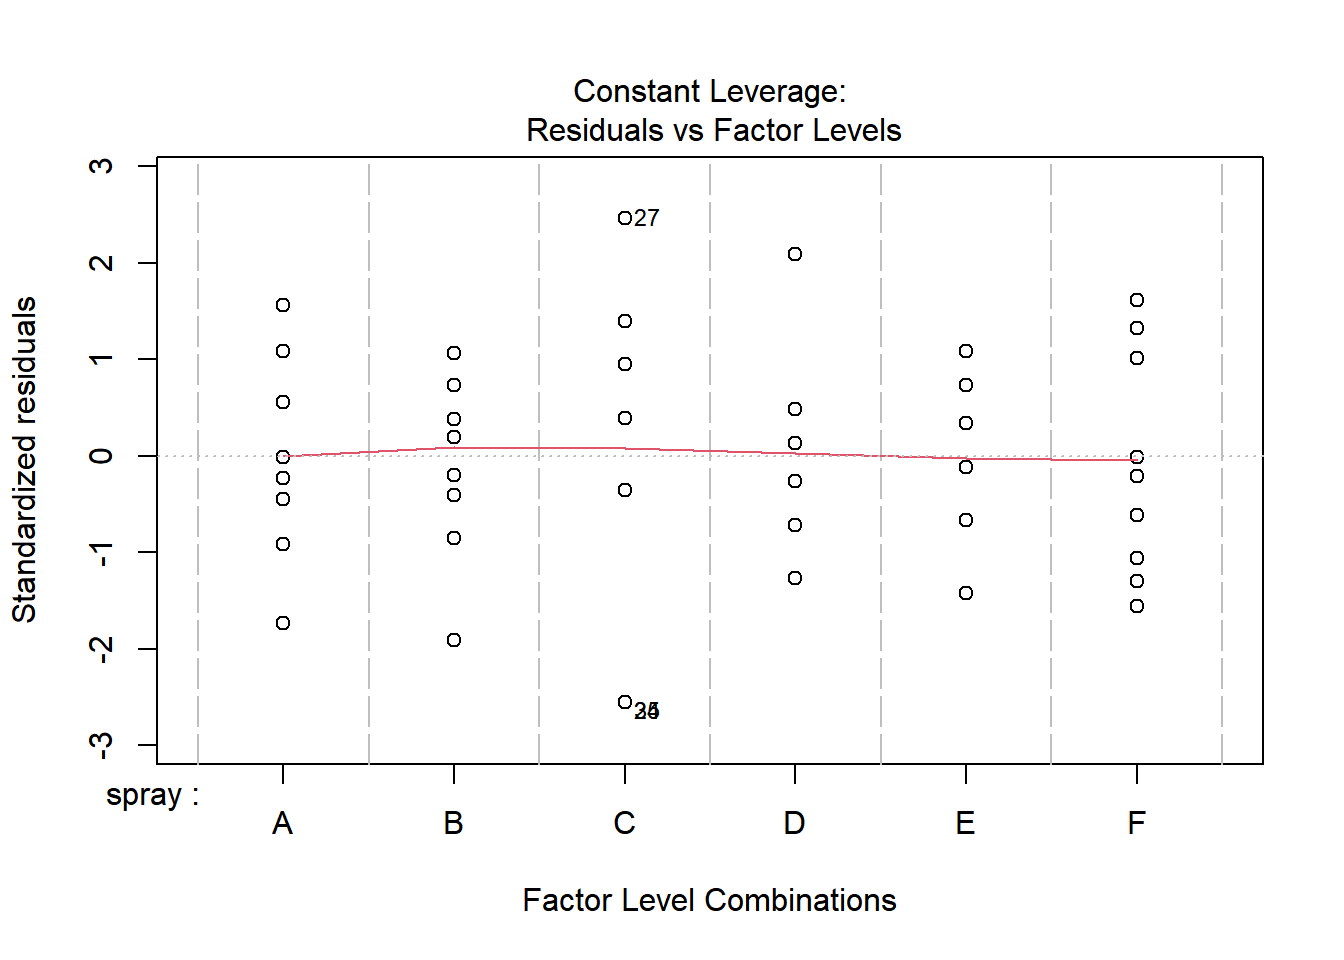
library(agricolae)insects <- InsectSpraysm1 <-lm(sqrt(count) ~ spray, data = insects)plot(m1)
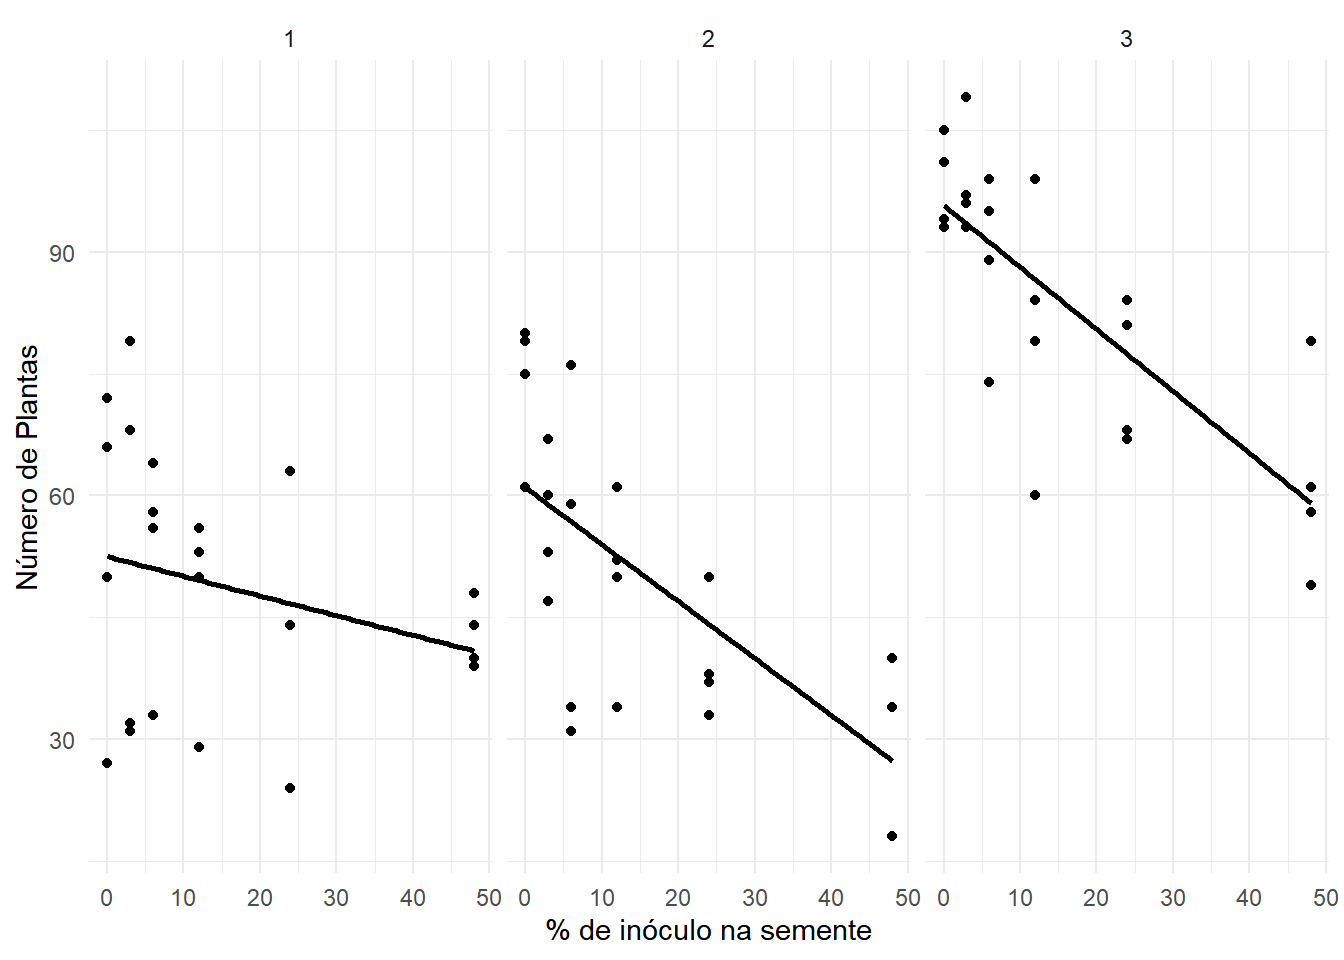
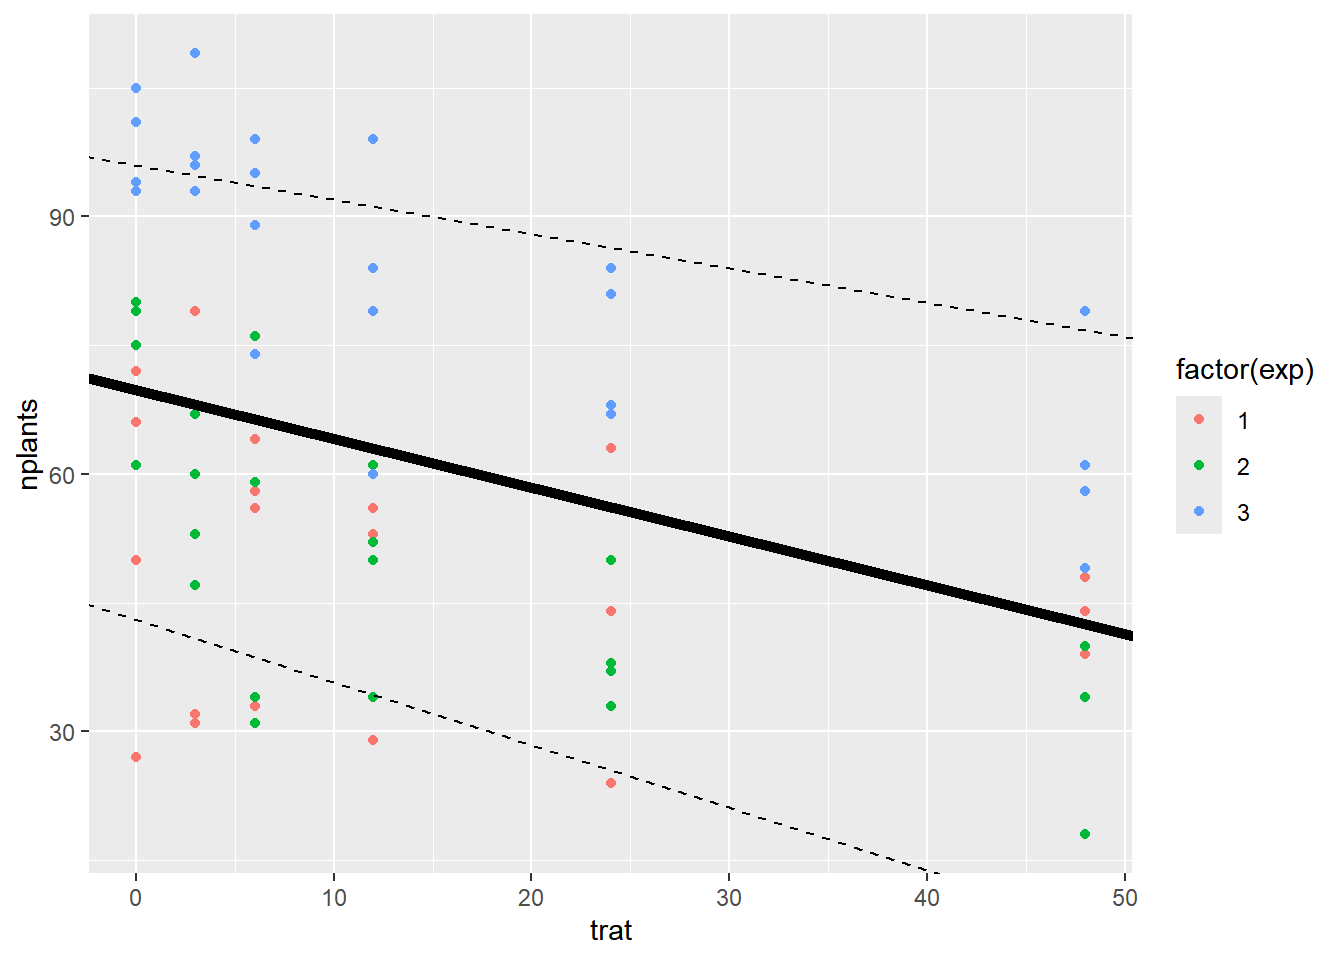
library(gsheet)library(ggplot2)estande <-gsheet2tbl("https://docs.google.com/spreadsheets/d/1bq2N19DcZdtax2fQW9OHSGMR0X2__Z9T/edit?gid=401662555#gid=401662555")ggplot(estande, aes(x = trat, y = nplants)) +geom_point() +geom_smooth(method ="lm", se =FALSE, color ="black") +facet_wrap(~exp) +theme_minimal() +labs(x ="% de inóculo na semente", y ="Número de Plantas")
`geom_smooth()` using formula = 'y ~ x'
Modelos Individuais por Experimento
exp1 <-filter(estande, exp ==1)m_exp1 <-lm(nplants ~ trat, data = exp1)summary(m_exp1)
Call:
lm(formula = nplants ~ trat, data = exp1)

Residuals:
    Min      1Q  Median      3Q     Max
-25.500  -6.532   1.758   8.573  27.226

Coefficients:
            Estimate Std. Error t value Pr(>|t|)
(Intercept)  52.5000     4.2044  12.487 1.84e-11 ***
trat         -0.2419     0.1859  -1.301    0.207
---
Signif. codes:  0 '***' 0.001 '**' 0.01 '*' 0.05 '.' 0.1 ' ' 1

Residual standard error: 15 on 22 degrees of freedom
Multiple R-squared:  0.07148,   Adjusted R-squared:  0.02928
F-statistic: 1.694 on 1 and 22 DF,  p-value: 0.2066
exp2 <-filter(estande, exp ==2)m_exp2 <-lm(nplants ~ trat, data = exp2)summary(m_exp2)
Call:
lm(formula = nplants ~ trat, data = exp2)

Residuals:
     Min       1Q   Median       3Q      Max
-25.7816  -7.7150   0.5653   8.1929  19.2184

Coefficients:
            Estimate Std. Error t value Pr(>|t|)
(Intercept)  60.9857     3.6304  16.798 4.93e-14 ***
trat         -0.7007     0.1605  -4.365 0.000247 ***
---
Signif. codes:  0 '***' 0.001 '**' 0.01 '*' 0.05 '.' 0.1 ' ' 1

Residual standard error: 12.95 on 22 degrees of freedom
Multiple R-squared:  0.4641,    Adjusted R-squared:  0.4398
F-statistic: 19.05 on 1 and 22 DF,  p-value: 0.0002473
exp3 <-filter(estande, exp ==3)m_exp3 <-lm(nplants ~ trat, data = exp3)summary(m_exp3)
Call:
lm(formula = nplants ~ trat, data = exp3)

Residuals:
     Min       1Q   Median       3Q      Max
-26.5887  -3.9597   0.7177   5.5806  19.8952

Coefficients:
            Estimate Std. Error t value Pr(>|t|)
(Intercept)  95.7500     2.9529  32.425  < 2e-16 ***
trat         -0.7634     0.1306  -5.847 6.97e-06 ***
---
Signif. codes:  0 '***' 0.001 '**' 0.01 '*' 0.05 '.' 0.1 ' ' 1

Residual standard error: 10.53 on 22 degrees of freedom
Multiple R-squared:  0.6085,    Adjusted R-squared:  0.5907
F-statistic: 34.19 on 1 and 22 DF,  p-value: 6.968e-06
Modelo Linear Misto
library(lme4)
Carregando pacotes exigidos: Matrix
Anexando pacote: 'Matrix'
Os seguintes objetos são mascarados por 'package:tidyr':

    expand, pack, unpack
library(car)
Carregando pacotes exigidos: carData
Anexando pacote: 'car'
O seguinte objeto é mascarado por 'package:dplyr':

    recode
O seguinte objeto é mascarado por 'package:purrr':

    some
m_misto <-lmer(nplants ~ trat + (1| exp/bloco), data = estande)summary(m_misto)
Linear mixed model fit by REML ['lmerMod']
Formula: nplants ~ trat + (1 | exp/bloco)
   Data: estande

REML criterion at convergence: 575.8

Scaled residuals:
     Min       1Q   Median       3Q      Max
-2.21697 -0.63351  0.04292  0.67094  1.92907

Random effects:
 Groups    Name        Variance Std.Dev.
 bloco:exp (Intercept)  54.76    7.40
 exp       (Intercept) 377.43   19.43
 Residual              134.99   11.62
Number of obs: 72, groups:  bloco:exp, 12; exp, 3

Fixed effects:
            Estimate Std. Error t value
(Intercept) 69.74524   11.57191   6.027
trat        -0.56869    0.08314  -6.840

Correlation of Fixed Effects:
     (Intr)
trat -0.111